A Guide to Working with Census Data in R
Written by the R Consortium Census Working Group
Sponsored by the R Consortium as part of the R Consortium Census Working Group
The U.S. Census Bureau is the premier source of data about America’s people, places and economy. This makes the Bureau a natural source of information for data analysts. R programmers who start working with Census Data, however, often run into two problems:
-
Understanding what data the Census Bureau publishes.
-
Understanding what packages on CRAN are available to help with their project.
This document aims to help R programmers who are confronted with these problems. It has three parts:
Part 1: What the Census Bureau Provides
The Census Bureau is the federal government’s largest statistical agency. The Census Bureau’s mission is to serve as the nation’s leading provider of quality data about its people and economy. Our goal is to provide the best mix of timeliness, relevancy, quality, and cost for the data we collect and services we provide. We honor privacy, protect confidentiality, share our expertise globally, and conduct our work openly. We are guided on this mission by scientific objectivity, our strong and capable workforce, our devotion to research-based innovation, and our abiding commitment to our customers. Please see this at a glance to learn more about the U.S. Census Bureau.
Data
Broadly speaking, the Census Bureau publishes three primary types of data: demographic, economic and geographic.
The Census Bureau conducts over 130 surveys and programs each year, including our nation’s largest:
- household survey, the American Community Survey
- business survey, Quarterly Services Survey
- Decennial Census, Decennial Census of Population and Housing
You can view the full list of programs here, and a full list of programs by topic using the Census survey explorer here.
Demographic Data
The Demographic Programs Directorate provides relevant and accurate information on the size, distribution, and characteristics of the nation’s population, income and poverty, and housing. This area bridges the gap between censuses, and provides information for policy decisions to promote the economic and social well being of the United States.
-
American Community Survey (ACS). The ACS regularly gathers information previously contained only in the long form of the decennial census, such as ancestry, educational attainment, income, language proficiency, migration, disability, employment, and housing characteristics. These data are used by many public-sector, private-sector, and not-for-profit stakeholders to allocate funding, track shifting demographics, plan for emergencies, and learn about local communities. Sent to approximately 295,000 addresses monthly (or 3.5 million per year), it is the largest household survey that the Census Bureau administers. (Source: Wikipedia).
-
Decennial Census of Population and Housing. The Decennial Census is what most people think of when they think of “The Census”. It counts each resident of the country, where they live on April 1, every ten years ending in zero. The Constitution mandates the enumeration to determine how to apportion the House of Representatives among the states. The Decennial Census is the largest peacetime mobilization in the US. (Source: Decennial Census of Population and Housing).
-
Population Estimates Program (PEP). Each year, PEP publishes estimates of the population for the nation, states, counties, state/county equivalents, and Puerto Rico. It estimates the resident population for each year since the most recent decennial census by using measures of population change (i.,e. births, deaths and migration). The resident population includes all people currently residing in the United States. PEP estimates are used for federal funding allocations, as controls for major surveys including the Current Population Survey and the American Community Survey, for community development, to aid business planning, and as denominators for statistical rates. (Source: PEP Methodology Paper).
-
International Data Base. The International Data Base (IDB) was developed to provide access to accurate and timely demographic measures for populations around the world. The database includes a comprehensive set of indicators, as produced by the U.S. Census Bureau since the 1960s. The IDB is updated on a regular basis to provide information needed for research, program planning, and policy-making decisions, in the U.S. and globally. (Source: International Data Base).
Economic Data
The US Census Bureau’s Economic Directorate is responsible for statistical programs that measure and profile U.S. businesses and government organizations. Its mission is to use transparent, scientific methods to provide broad and impartial information on the changing US economy for use in public and private sector decision making, and its vision to use innovative methods to address stakeholder needs in real time. To accomplish this, it conducts an Economic Census and a Census of Governments every five years and over 60 surveys taken monthly, quarterly, annually, or periodically to produce numerous data products, twelve principal economic indicators, extensive compilations of administrative records, and many research and technical studies.
-
Economic Census: The Economic Census is the official five-year measure of businesses in the United States providing comprehensive statistics at the national, state, and local levels. It serves as the benchmark for current economic activity, such as the Gross Domestic Product and Producer Price Index. (Source: Economic Census).
-
Annual Integrated Economic Survey: The Annual Integrated Economic Survey (AIES) is a re-engineered survey designed to integrate and replace seven existing annual business surveys into a streamlined single survey. It is designed to be easier for businesses to complete, result in better and more timely data, and allow the Census Bureau to reduce costs and operate more efficiently. (Source: Annual Integrated Economic Survey).
-
Annual Business Survey: The ABS Program combines data results from survey respondents and administrative records to produce data on business ownership. The survey is collected from employer businesses and the nonemployer data are compiled from administrative records. (Source: Annual Business Survey).
-
Quarterly Services Survey: The Quarterly Services Survey (QSS) is the only source of service industry indicator performance providing timely estimates of revenue and expenses for selected service industries. The Bureau of Economic Analysis (BEA) uses QSS data in its estimates of Gross Domestic Product (GDP). (Source: Quarterly Services Survey).
Geographic Data
The Geography program is central to the work of the Census Bureau. Statistics are normally reported for either the entire nation, or some specific geographic subdivision of the country.
Most Americans can name the State, County and ZIP Code that they live in. But as the diagram below shows, the Census Bureau’s geographic hierarchy is much more complex than that!
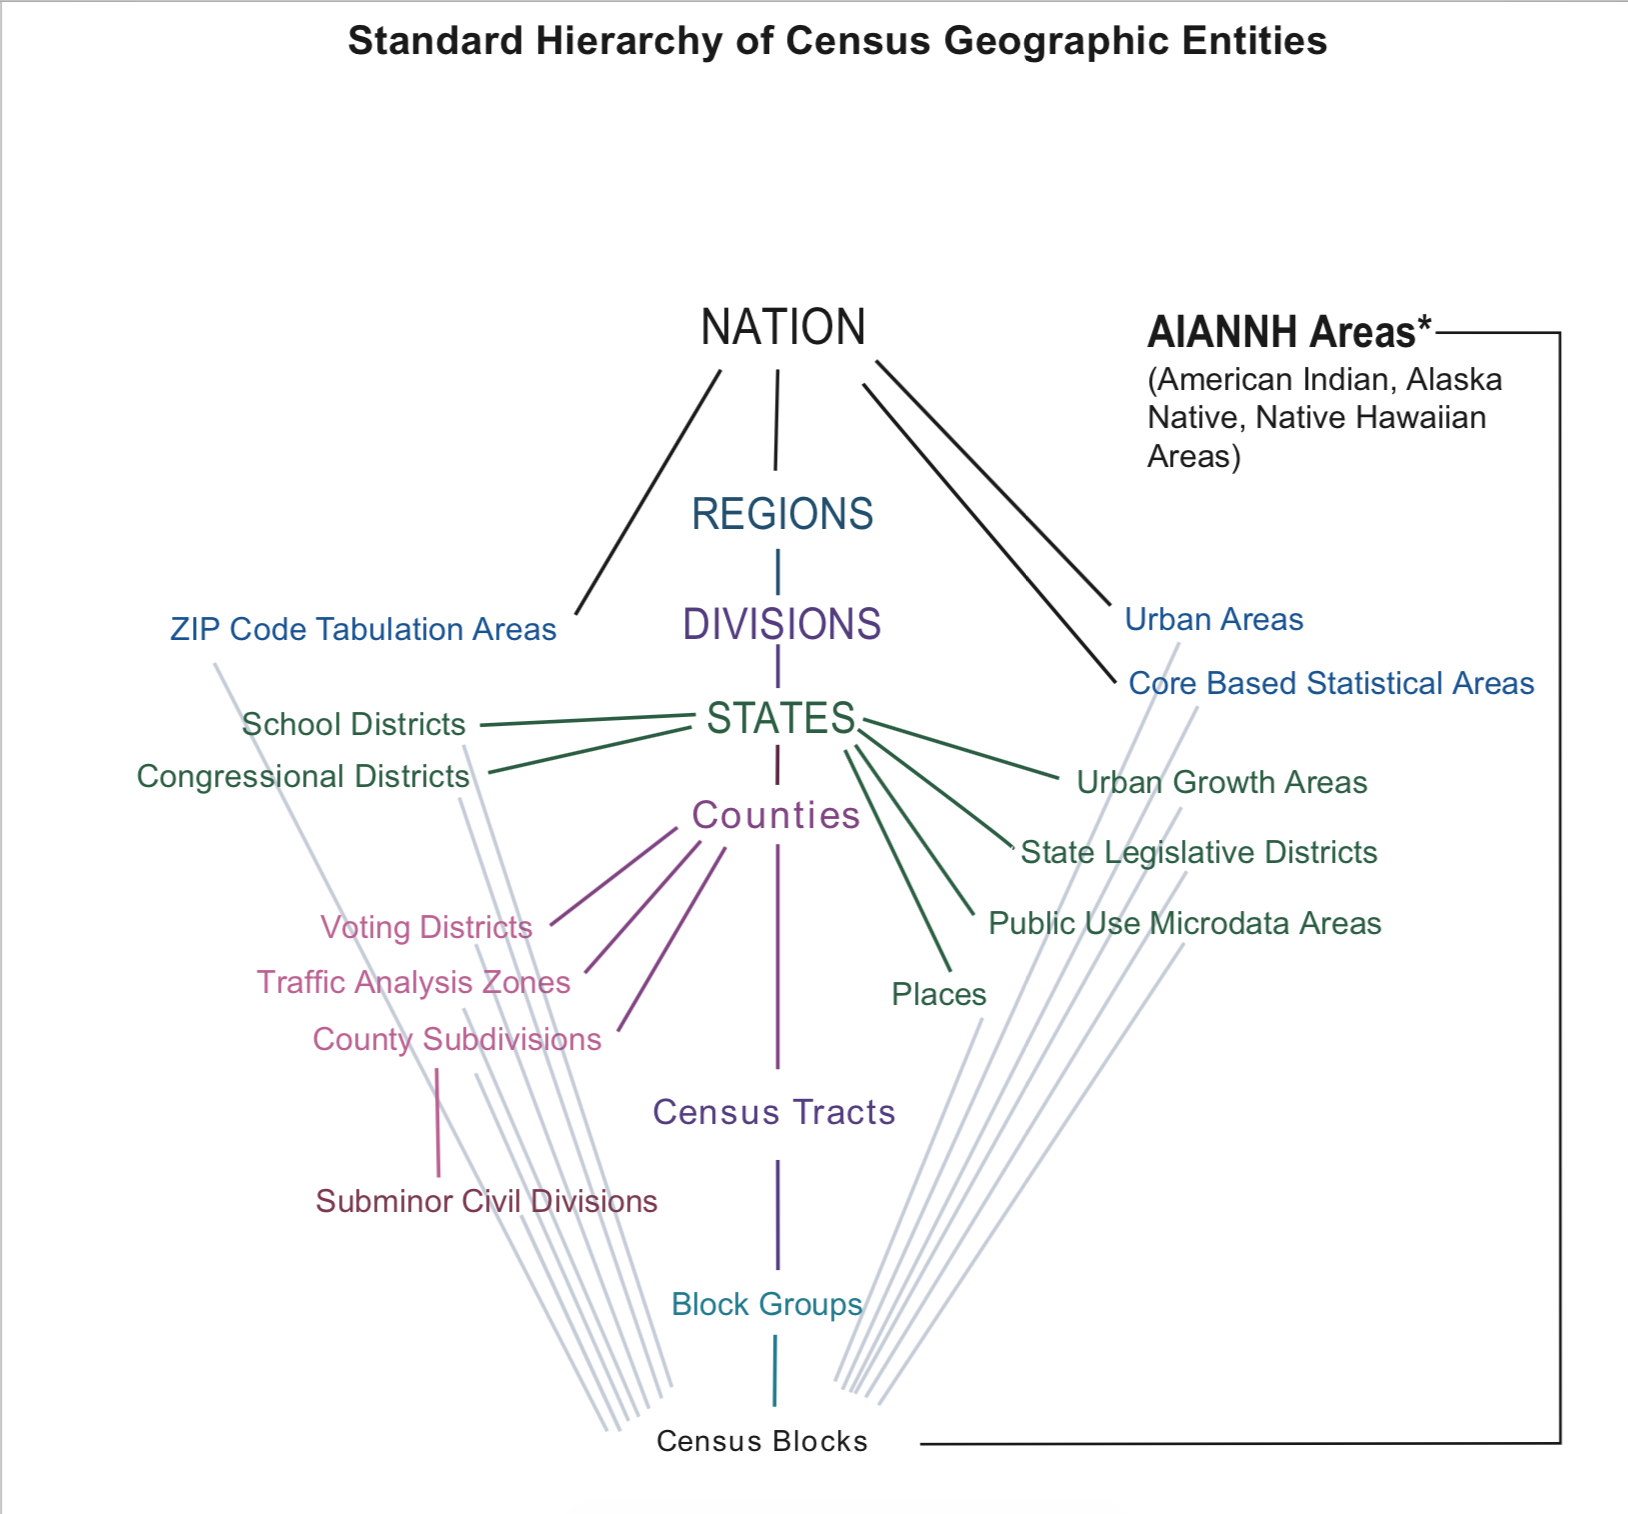 (Source: Standard Hierarchy of Census Geographic Entities)
Note that most datasets provide data for only a subset of these geographies. For example:
(Source: Standard Hierarchy of Census Geographic Entities)
Note that most datasets provide data for only a subset of these geographies. For example:
- The Decennial Census publishes data down to Block level (the smallest geography).
- The American Community Survey (ACS) publishes data down to the Block Group level (the level above Blocks).
- The Population Estimates Program (PEP) only publishes data down to the county level (two levels above the Block Group level). Census provides free access to its geographic data and products such as the TIGER/Line Shapefiles, KMLs, TIGERweb, cartographic boundary files, geographic relationship files, and reference and thematic maps.
Data Dissemination
The primary tools that Census uses to disseminate its data are data.census.gov and their API.
data.census.gov
data.census.gov is a web application that can help you explore Census data and navigate the various datasets that Census publishes. In addition to allowing interactive searches to create data tables on the website, there is an option to download data as a CSV file which you can then import into R.
API
The Census Bureau has an API which provides access to many of its datasets. You can learn more about the API, including which datasets are available, here.
- Using the API requires a getting an API Key, which you can get for free here.
- See here for the Census Data API User Guide.
- Explore the ABCs of the Census API with Census Bureau staff.
- See here for a tutorial on Census API Basics: Simple Steps to Better Data Access
- See here for a tutorial on Using the API to Get All Results for an ACS Table.
- See here for a tutorial on Using the API to Get Results for Multiple Estimates.
- Explore ACS Data Stories–Stats in Action! to see how the public is using ACS data.
- Visit the Slack show-and-tell channel and show how you use Census data.
Part 2: How CRAN Can Help
CRAN provides access to thousands of user contributed R packages. We were able to identify 22 of those packages as being related to the US Census Bureau. You can view the full list of those packages here.
Below are descriptions of a subset of those packages which we believe are likely to be of special interest to people reading this Guide. You can learn about our methodology for deciding which packages to include in this list here.
-
tigris. Download TIGER/Line shapefiles from the United States Census Bureau (https://www.census.gov/geo/maps-data/data/tiger-line.html) and load into R as ‘SpatialDataFrame’ or ‘sf’ objects.
-
choroplethr. Choroplethr facilitates creating choropleth maps of data at the State, County and Tract level through the functions
?state_choropleth,?county_choroplethand?tract_choropleth. Choropleths are thematic maps where geographic regions, such as states, are colored according to some metric, such as the number of people who live in that state.In addition to being a general purpose mapping package, choroplethr provides native support for mapping data from the American Community Survey (ACS) through functions such as
?get_state_demographicsand?get_acs_data. You can learn more about choroplethr at Choroplethr.com. -
tidycensus. An integrated R interface to the decennial US Census and American Community Survey APIs and the US Census Bureau’s geographic boundary files. Allows R users to return Census and ACS data as tidyverse-ready data frames, and optionally returns a list-column with feature geometry for many geographies.
-
choroplethrMaps. choroplethrMaps contains the Census Bureau’s 2010 US State Map (see
?state.map) and 2010 US County Map (see?county.map). These maps were modified in order to make them easier to render (for example, islands off the coast of Alaska that cross the antimeridian were removed).Additional metadata about these maps can be found in
?state.regionsand?county.regions. You can learn more about choroplethrMaps at Choroplethr.com. -
censusapi. A wrapper for the U.S. Census Bureau APIs that returns data frames of Census data and metadata. Available datasets include the Decennial Census, American Community Survey, Small Area Health Insurance Estimates, Small Area Income and Poverty Estimates, and Population Estimates and Projections. See https://www.census.gov/data/developers/data-sets.html for more information.
-
ipumsr. The ipumsr package assists in the import and use of IPUMS extracts in R. IPUMS data is a repackaging of census and survey data from around the world to a format harmonized across space and time and with enhanced documentation. With IPUMS data, it easy to study change, conduct comparative research, merge information across data types, and analyze individuals within family and community context. Users can go to the IPUMS website and create an extract with only the samples and variables they are interested in, and then import their downloaded extract with the ipumsr package.
Several IPUMS projects include data from the US Census Bureau:
- IPUMS USA repackages the public use microdata from the US Census and American Community Survey from 1850 to the present.
- NHGIS provides population, housing, agricultural, and economic data, along with GIS-compatible boundary files, for geographic units in the United States from 1790 to the present.
- IPUMS CPS provides the Current Population Survey which is a monthly workforce survey conducted by the Census Bureau.
- IPUMS International includes the US Census microdata in the same format as census data from 93 other countries.
The
ipumsrpackage also provides functions for creating data extracts and browsing metadata programmatically via the IPUMS API. -
zctaCrosswalk. Contains the US Census Bureau’s 2020 ZCTA to County Relationship File, as well as convenience functions to translate between States, Counties and ZIP Code Tabulation Areas (ZCTAs).
-
usdata. Demographic data on the United States at the county and state levels spanning multiple years. Allows for conversion between state abbreviations and names. Includes data collected from Census Quick Facts (note: no longer available as of 2020) and its accompanying pages. Provides county level data from various years 2000 to 2019, demographic, population, labor and employment, election and voter turnout information, and more.
-
cdlTools. Downloads USDA National Agricultural Statistics Service (NASS) cropscape data for a specified state. Utilities for fips, abbreviation, and name conversion are also provided. Full functionality requires an internet connection, but data sets can be cached for later off-line use. Note: The function census2010FIPS contains U.S. Census 2010 FIPS Data containing county names, state and county FIPS codes, and state abbreviations. The very useful function fips converts U.S. state and county names and abbreviations to and from FIPS codes.
-
censable. Creates a common framework for organizing, naming, and gathering population, age, race, and ethnicity data from the Census Bureau. Accesses the API. Provides tools for adding information to existing data to line up with Census data.
-
censusr. Use the US Census API to collect summary data tables for SF1 and ACS datasets at arbitrary geographies.
-
cpsR. Load Current Population Survey (CPS) microdata into R using the ‘Census Bureau Data’ API, including basic monthly CPS and CPS ASEC microdata.
-
cpsvote. Provides automated methods for downloading, recoding, and merging selected years of the Current Population Survey’s Voting and Registration Supplement, a large N national survey about registration, voting, and non-voting in United States federal elections. Provides documentation for appropriate use of sample weights to generate statistical estimates, drawing from Hur & Achen (2013).
-
easycensus. Extracting desired data using the proper Census variable names can be time-consuming. This package takes the pain out of that process by providing functions to quickly locate variables and download labeled tables from the Census APIs.
-
ppmf. Implements data processing to align modern differentially private data with formatting of older US Census data releases. The primary goal is to read in Census Privacy Protected Microdata Files data in a reproducible way. This includes tools for aggregating to relevant levels of geography by creating geographic identifiers which match the US Census Bureau’s numbering. Additionally, there are tools for grouping race numeric identifiers into categories, consistent with OMB (Office of Management and Budget) classifications. Functions exist for downloading and linking to existing sources of privacy protected microdata.
-
predictrace. Predicts the most common race of a surname and based on U.S. Census data, and the most common first named based on U.S. Social Security Administration data.
-
us.census.geoheader. A simple interface to the Geographic Header information from the “2010 US Census Summary File 2”. Note that this package only provides access to parts of the geographic header (‘geoheader’) of the file. In particular, only the first 101 columns of the geoheader are included and, more importantly, only rows with summary levels (SUMLEVs) 010 through 050 (nation down through county level) are included. In addition to access to (part of) the geoheader, the package also provides a decode function that takes a column name and value and, for certain columns, returns “the meaning” of that column (i.e., a “SUMLEV” value of 40 means “State”); without a value, the decode function attempts to describe the column itself.
Part 3: How to Learn More
Census Bureau
The Census Bureau’s latest training initiative is Census Academy, which contains free courses to teach you how to use Census data. Census Academy also has a free newsletter which will notify you when they release new courses. We encourage you to sign up for this newsletter if you wish to learn more about US Census Data.
The Census Bureau’s Training & Workshops page has a library of recorded webinars, training resources, how-to videos as well as information on classroom trainings that Census conducts.
The Census Bureau also runs a free Slack Community where you can ask questions and have them answered in real time. The community even has a channel (#r) specifically for R users!
If you have any additional questions, please contact the Data Dissemination Staff at Census:
- Phone: 1-844-ASK-DATA
- Email: census.askdata@census.gov
If you have any additional questions regarding the Census API, please contact the API team at Census:
- Slack: uscensusbureau.slack.com
- Email: census.data@census.gov
R Packages
If you have a specific question about an R package you are using, the best resource is normally the package maintainer. The CRAN page for each R package contains the email address of a Maintainer.
If you have a more general R question, or if you are unable to contact the package maintainer, then you might try asking your question on StackOverflow using the tag “R” (link). When asking questions on R, it is normally helpful to provide a reproducible example. You can learn more about reproducible examples here.